CRE underwriting
For investors evaluating a deal and brokers explaining buyer returns. Review assumptions, cash flow, and projected IRR.
Multifamily underwriting is available now · Other asset classes are in beta Learn More
Turnand deal financials into a shareable underwriting report.
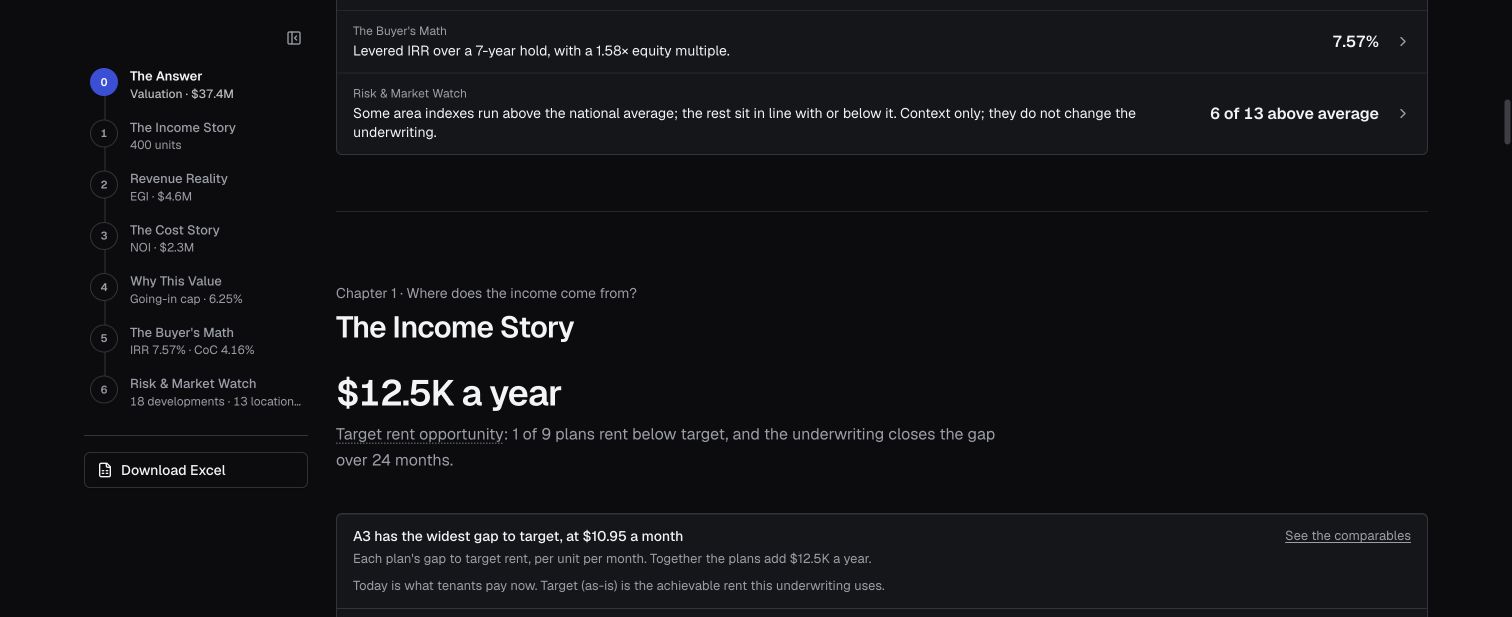
For investors evaluating a deal and brokers explaining buyer returns. Review assumptions, cash flow, and projected IRR.
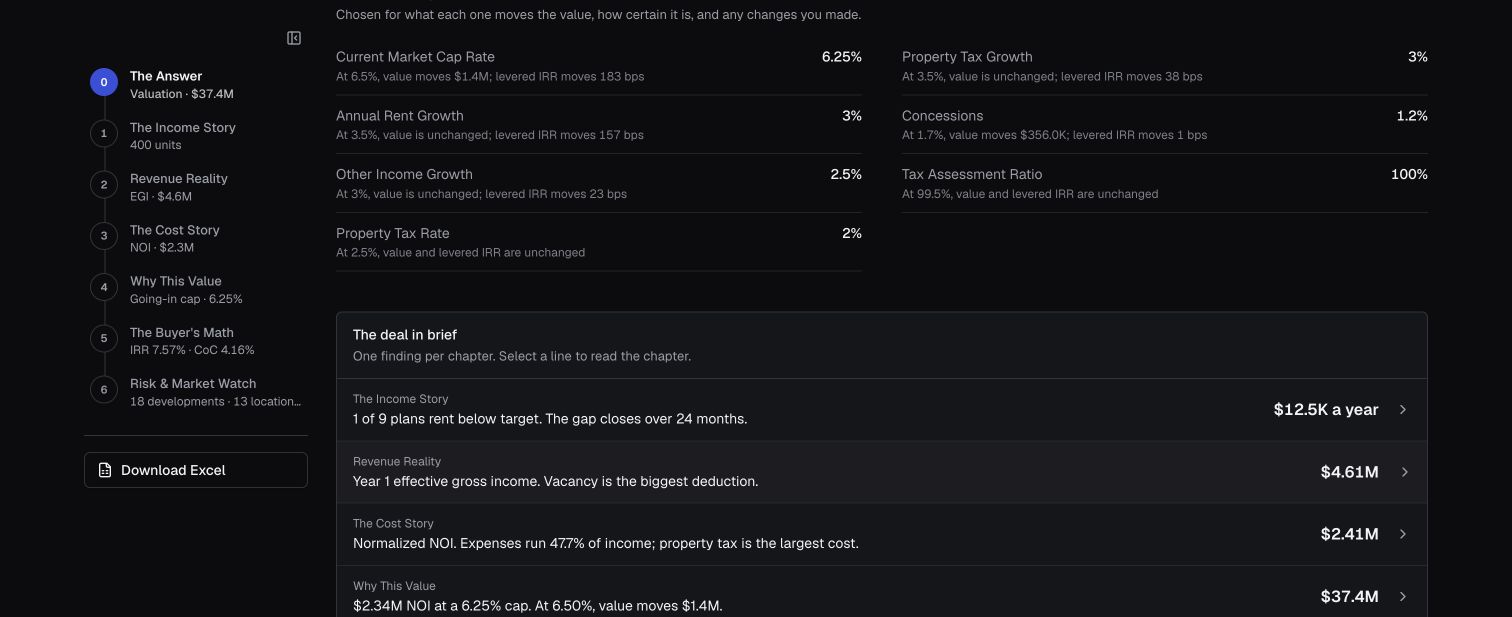
For owners, buyers, and brokers exploring property value. Understand the income, market evidence, and assumptions behind a price.


From the big picture to the numbers behind it.
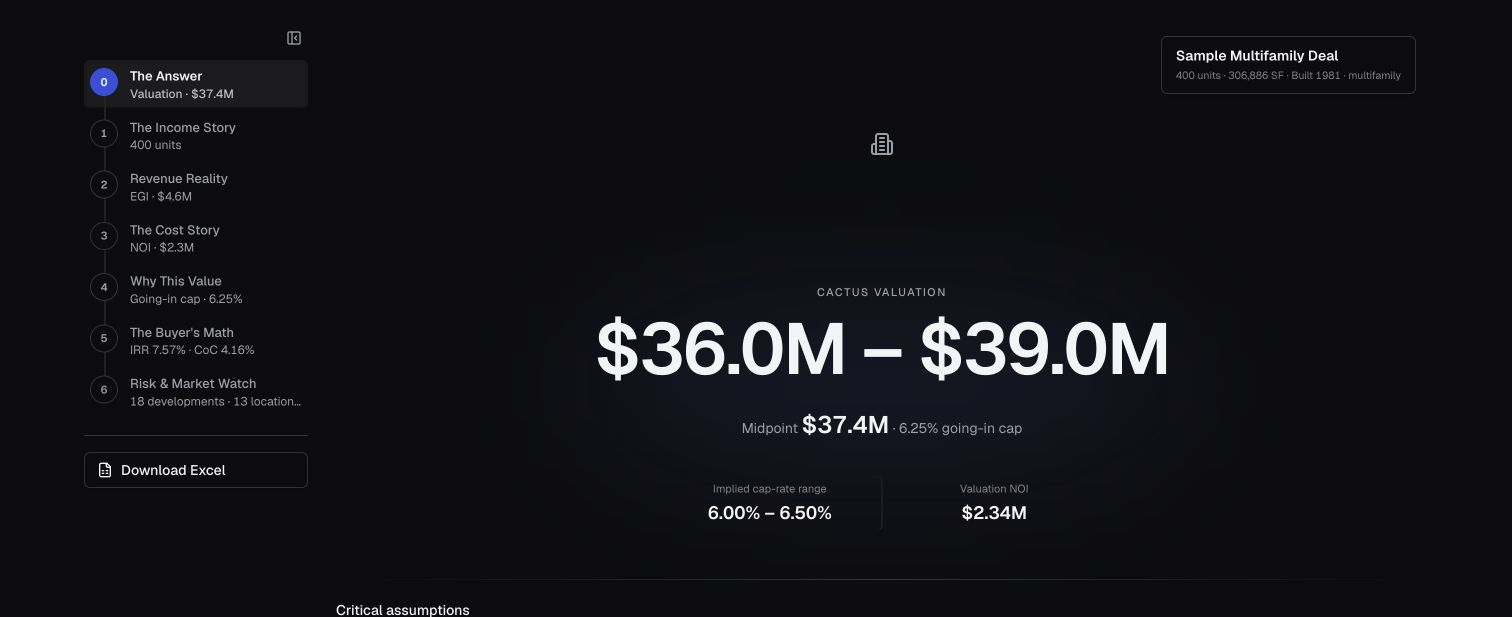
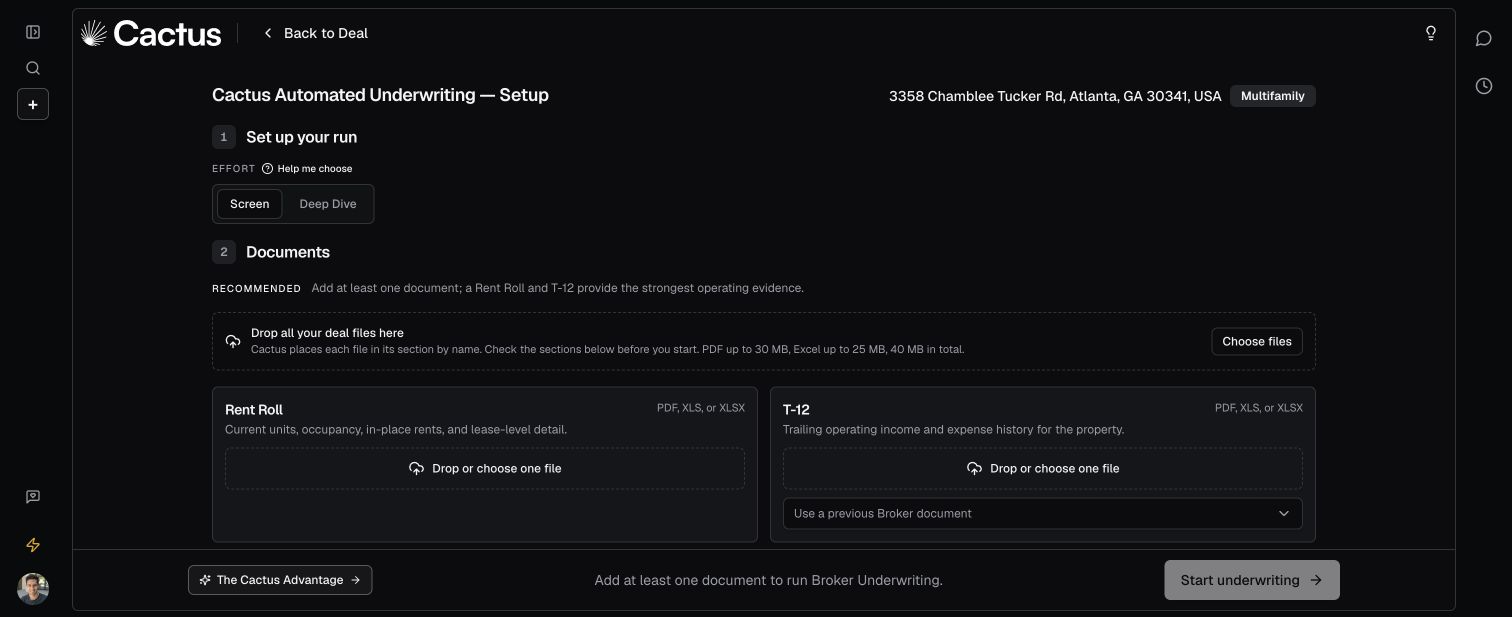
Drop in your rent roll, T-12, and offering memorandum. Cactus reads the files, extracts the financials, and reconciles the numbers across documents.
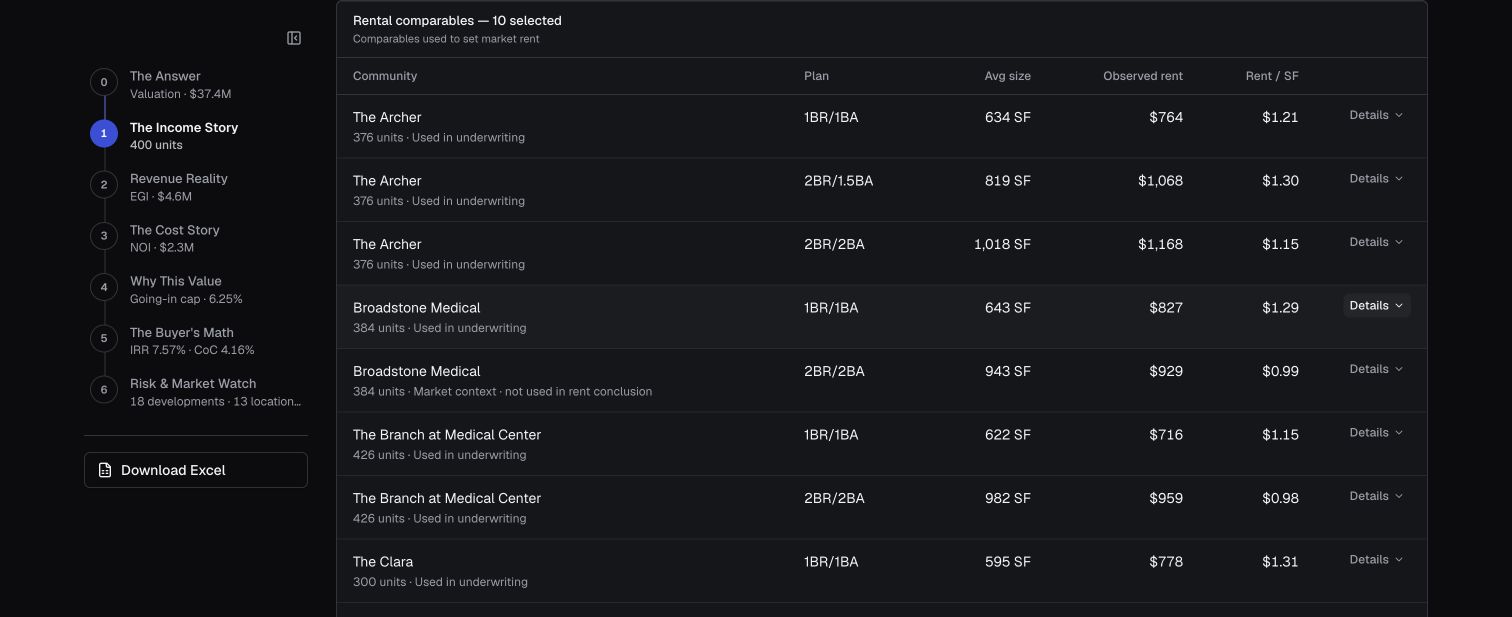
Rental comparables, local developments, and location signals, connected to your deal. See the evidence behind each assumption.
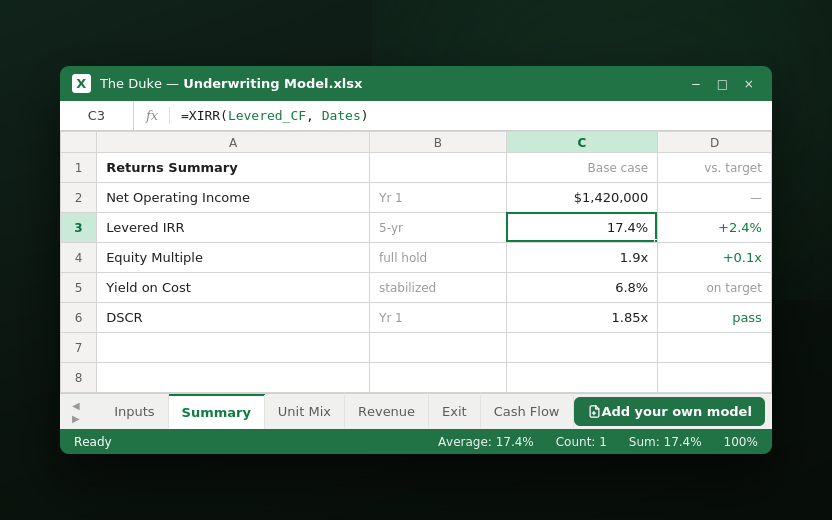
Open your model in Excel and follow the math. Editable assumptions, working formulas, and connected tabs let your team trace the results back to their inputs.
Specialist AI, professional financial models, and integrated market data. One place to understand a deal.
Property values, cash flows, and returns are computed with fixed financial formulas. AI prepares and explains the inputs; the model does the math.
Tuned by AI engineers for the work behind a deal: extracting documents, reconciling figures, researching the market, and reviewing the analysis.
Rental comparables, operating benchmarks, demographics, and development activity feed the analysis, with market evidence beside your assumptions.
Send documents from your inbox or start an analysis inside ChatGPT. Your Cactus report is just a link away.
Financial models made by professional investors and analysts. Inspect the assumptions, follow the formulas, and keep working in Excel.
Trace figures to source documents, inspect the market evidence, and see which assumptions need your review. The reasoning stays with the report.
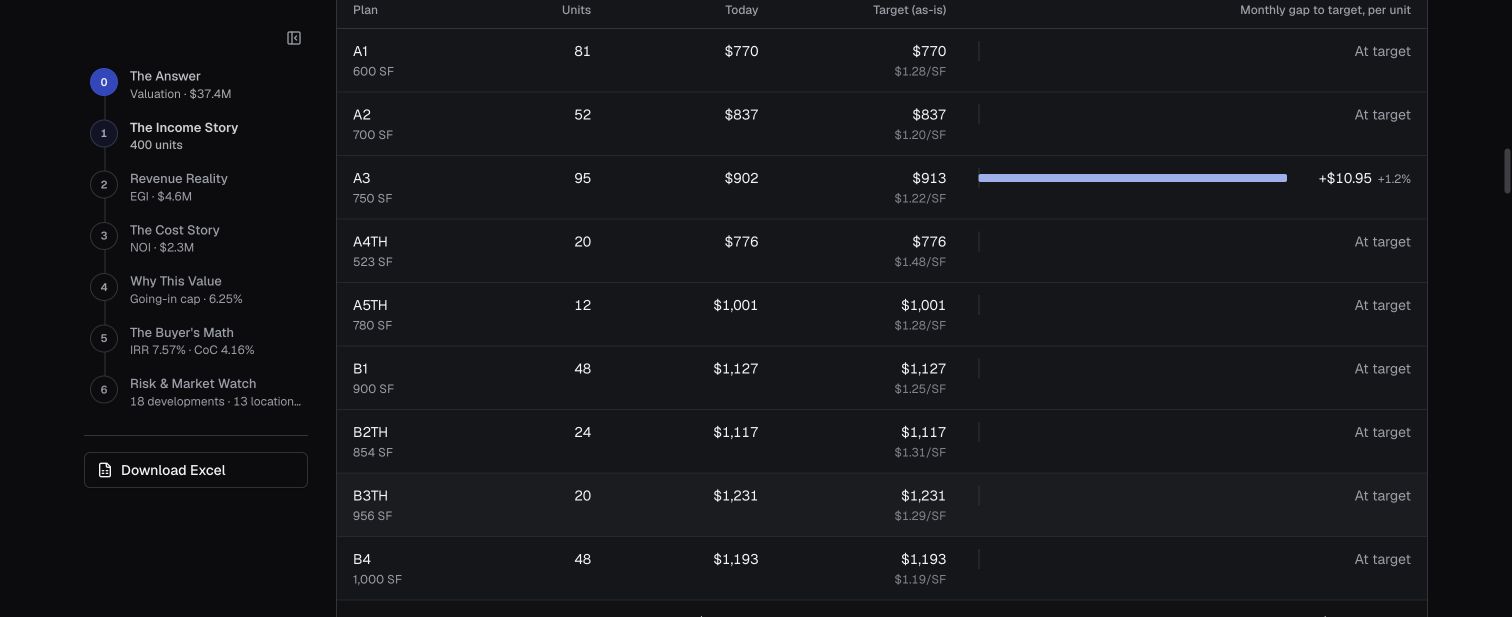
Parse T-12s, unit mix, loss-to-lease, renovation scope, payroll, taxes, and comp support before the model goes to IC.
Sign Up02Normalize unit sizes, in-place vs street rates, occupancy by type, discounts, expansion notes, and new-supply risk before sizing the deal.
Explore storage beta03Track clear height, dock doors, power, trailer parking, truck access, lease rollover, tenant credit, and comp evidence in one trail.
Explore industrial beta04Review rent rolls, sales, co-tenancy clauses, CAM/NNN recoveries, anchor exposure, leakage, and demand signals beside the source.
Explore retail beta05Map expirations, TI/LC, concessions, downtime, vacancy, medical buildout, tenant credit, and comps back to supporting files.
Explore office beta06Connect P&Ls, STR trends, RevPAR, seasonality, labor, PIP/capex, group mix, and demand generators to each assumption.
Explore hospitality beta07Keep zoning, utilities, constraints, impact fees, entitlements, phasing, absorption, and schedule risk tied to feasibility.
Explore land beta08Embed source-backed extraction, tenant/property matching, approval gates, audit trails, and model-ready CRE data into product workflows.
Explore PropTech betaCommon questions from CRE teams evaluating automated property analysis.
Defensible means every important input in the deal has a visible reason behind it. The defensibility stack is:User assumption + market checkThe user can make a judgment call, while Cactus validates, challenges, or contextualizes it against the market.Document / historical citationsUploaded P&Ls, T-12s, rent rolls, OMs, budgets, and other source docs tie directly back to revenue, expenses, NOI, post-NOI, and other line items.Market comps / external dataRent comps, cap rates, concessions, growth, expenses, and other market signals anchor assumptions in real evidence.Open questionsMissing comparable evidence, older financial periods, and uncertain assumptions remain visible for the team to investigate.